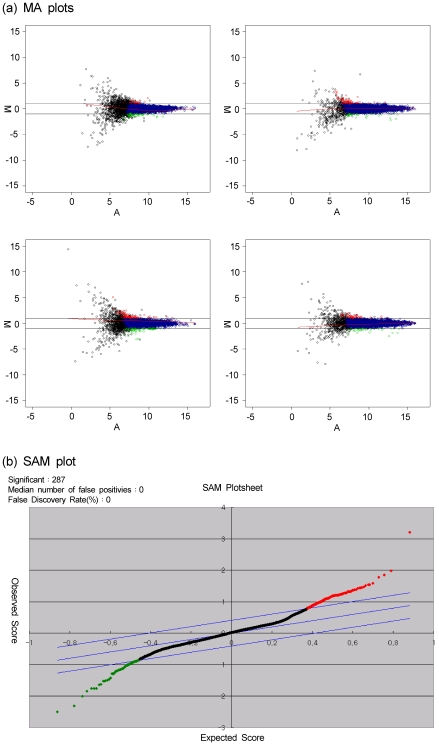
Fig. 2.
Representative MA plots and SAM plot
(a) Representative MA plots comparing the 3T3-L1 preadpocytes vs. the differentiated cells. M represents the log ratio of the two fluorescent dyes used to label probes, and A represents averaged logarithmic intensity. Broken line represents a 2-fold change. (b) SAM scatter plot of observed relative difference versus the expected relative difference. The genes showing significant difference in expression between the 3T3-L1 preadpocytes and the differentiated cells were identified. Broken line represents δ = 0.66.

