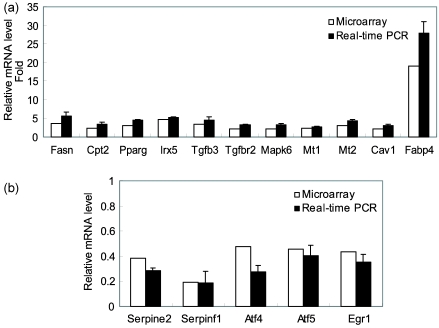
Fig. 4.
Comparison between cDNA microarray analysis and real time RT-PCR
3T3-L1 cells were treated with differentiation cocktail for two days and total RNA was isolated. The relative mRNA expression levels of genes were measured by real-time RT-PCR analysis with SYBRO green. Data are expressed as fold changes (means ± SD), normalized to β-actin mRNA expression, where the values for the 3T3-L1 preadipocytes were set at 1.00. The analyses were performed in triplicate.

