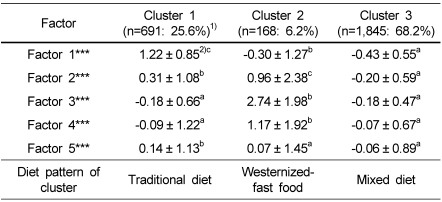
Table 2.
Classification of subjects by cluster analysis using factor score
1)Subject number and percent of total subject number, 2704.
2)Mean ± SD.
***p<0.001 by Generalized linear model.
abcValues with different superscripts in the same row were significantly different by Duncan's multiple range test at p<0.05.

