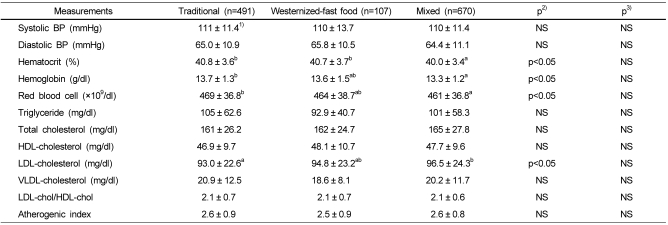
Table 5.
Blood pressure and plasma profiles by dietary patterns
BP: blood pressure.
1)Mean ± SD.
2)p value by Generalized linear model.
3)p value by ANCOVA with covariates of age and gender.
abcValues with different superscripts in the same row were significantly different by Duncan's multiple range test at p<0.05.

