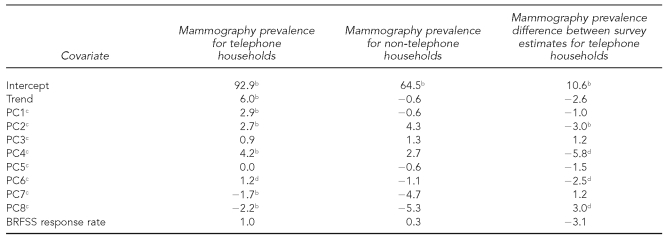
Table 4.
Estimates of model parameters for mammography prevalence for telephone households, for non-telephone households, and for the difference between survey estimates for telephone householdsa
aSources: BRFSS and National Health Interview Survey
bCoefficient differs from zero (p<0.01).
cPC1–PC8 denote the first eight principal components for the 26 initial covariates.
dCoefficient differs from zero (p<0.05).
BRFSS = Behavioral Risk Factor Surveillance System
PC = principal component

