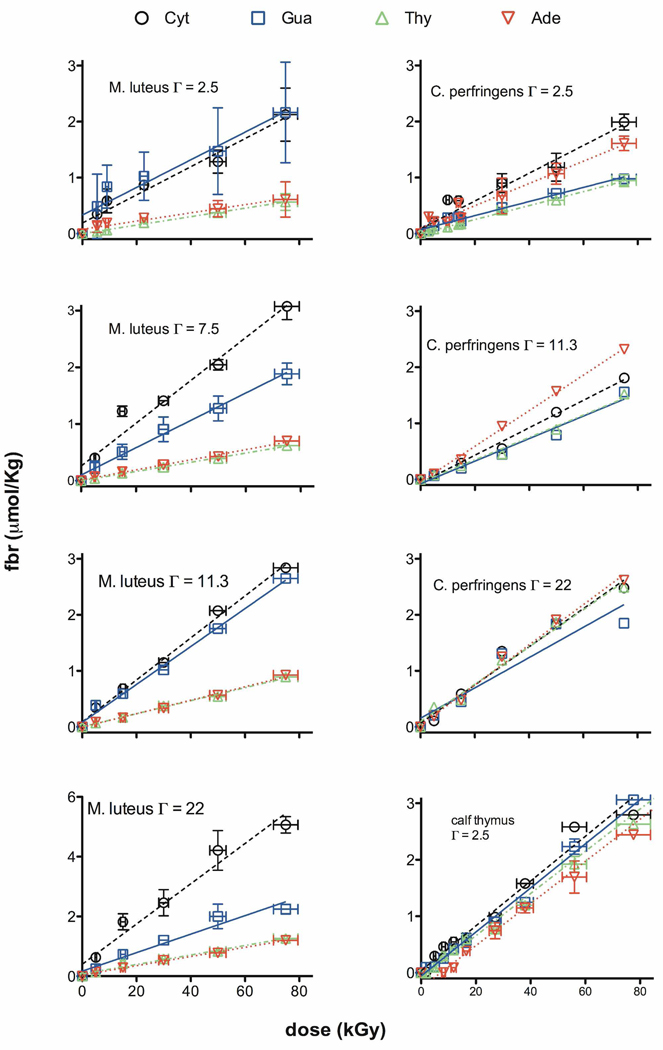
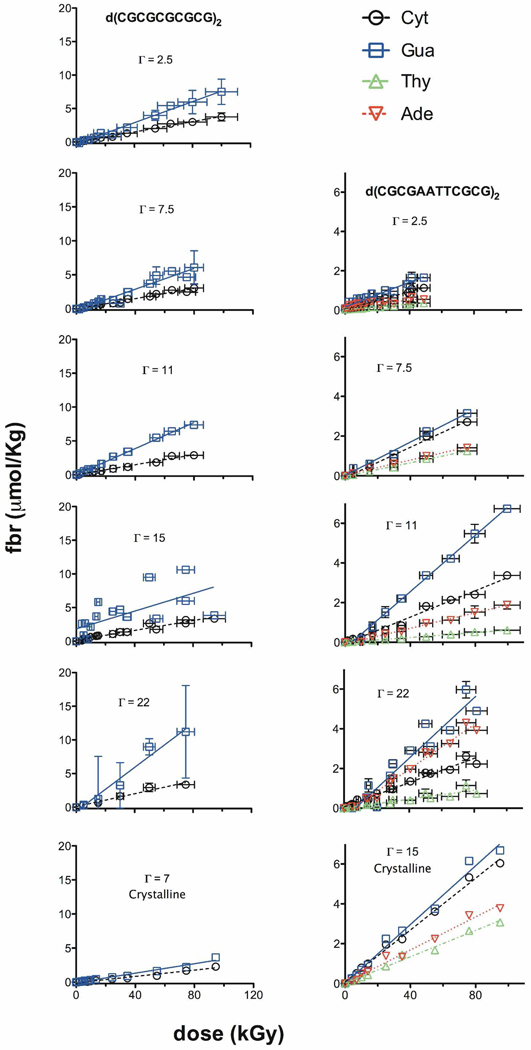
Figure 2.
Figure 2a. The dose response for release of Cyt, Gua, Thy, and Ade from X-irradiated films of Mlut and Cper DNA are shown for hydration levels of Γ = 2.5, 11.3, and 22 mol waters/mol nucleotide. The slopes of the linear-least-squares-fit curve give the chemical yields for release of each base: G(Cyt), G(Gua), G(Thy), and G(Ade). As explained in the text and shown in Table 2, the M-factors plotted in Figure 3 are calculated from the G values.
Figure 2b. The dose response for Cyt, Gua, Thy, and Ade release from X-irradiated d(CGCGCGCGCG)2 and d(CGCGAATTCGCG)2 in the form of films is shown for various hydration levels and in crystalline form. Note the increase in scatter at higher levels of hydration. This is due to an increase in background levels of fbr. Background fbr, recorded at zero dose, was subtracted from all data points.


