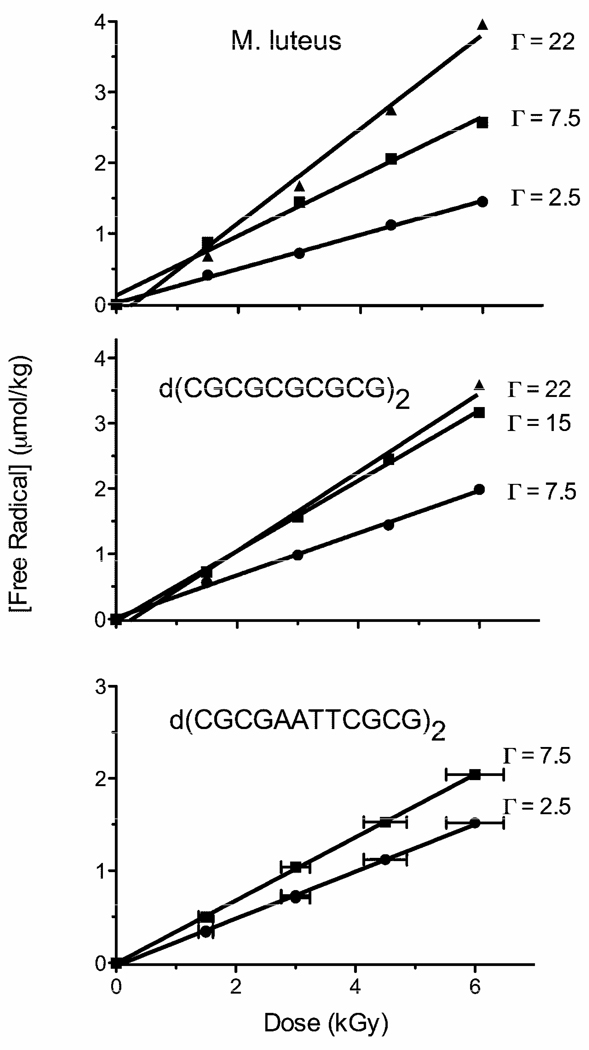
Figure 5.
Dose response curves for the concentration of DNA-trapped free radicals in Mlut, CGmer, and 12mer hydrated to the indicated levels of Γ. The slope of the linear-least-squares-fit curve gave the chemical yield for total radicals trapped on DNA at 4 K, Gtot(fr). These Gtot(fr) values, along with values from previous work, are listed in Table 3.

