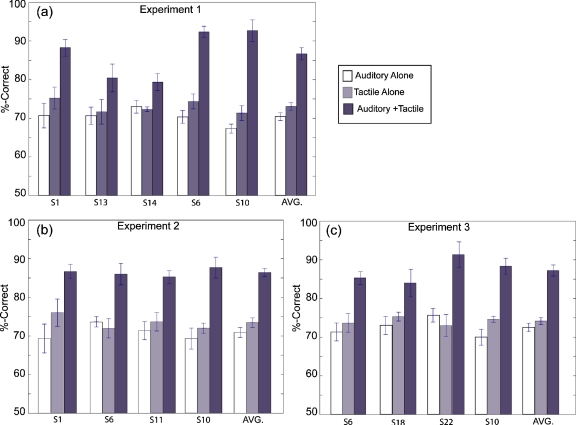
Figure 2.
Summary of results for the baseline condition in Experiments 1–3. Percent-correct scores for the individual subjects in each experiment are averaged across multiple repetitions per condition; number of repetitions varies by subject, and is equal to or greater than four per subject. AVG is an average across subjects and repetition in each experiment. White bars represent auditory-alone conditions, gray bars represent tactile-alone conditions, and black bars represent the A+T baseline condition with auditory and tactile frequencies=250 Hz, simultaneous presentation. Error bars are 1 SEM.

