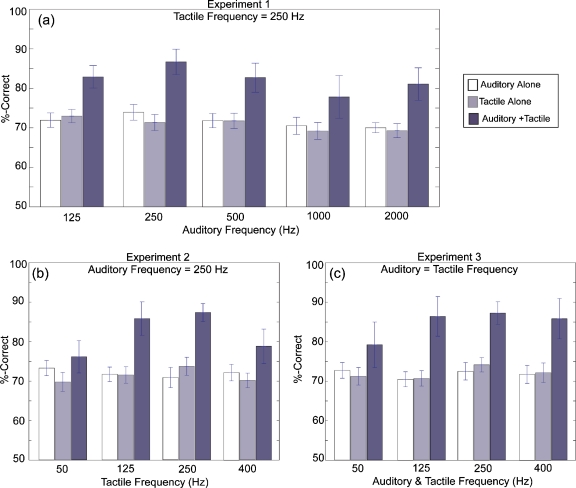
Figure 3.
Summary of results for Experiment 1 (3a), Experiment 2 (3b), and Experiment 3 (3c). Percent-correct scores are averaged across subjects and sessions. Scores are shown for A-alone (white bars), T-alone (light gray bars), and for combined A+T conditions (dark gray bars). In Experiment 1, scores are shown as a function of auditory frequency with tactile frequency=250 Hz. In Experiment 2, scores are shown as a function of tactile frequency with auditory frequency=250 Hz. In Experiment 3, scores are shown as a function of frequency where auditory=tactile. Error bars are 1 SEM.

