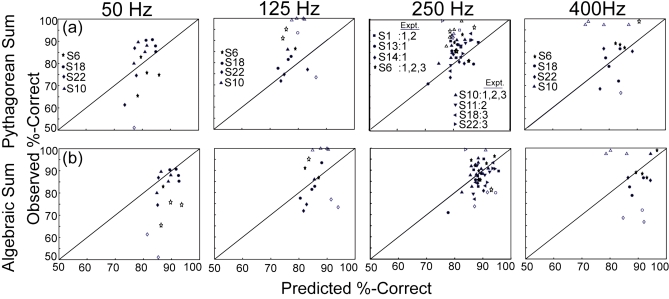
Figure 4.
Predicted vs observed values for the two models of integration, showing data for conditions in which the auditory and tactile frequencies are equal to one another. The top row (4a) represents the results of the Pythagorean sum model for the four equal-frequency conditions across experiments (from left to right: 50, 125, 250, and 400 Hz). The 250 Hz panel pools data across Experiments 1–3, while the remaining panels show data from Experiment 3. The bottom row (4b) represents the results of the algebraic sum model for the four equal-frequency conditions across experiments (from left to right: 50, 125, 250, and 400 Hz). The 250 Hz panel pools data across Experiments 1–3, while the remaining panels show data from Experiment 3. Results for each subject are delineated by shape (see legend) in each panel. Open symbols indicate that the observed value failed the chi-squared test and filled symbols indicate the observed value passed the chi-squared test.

