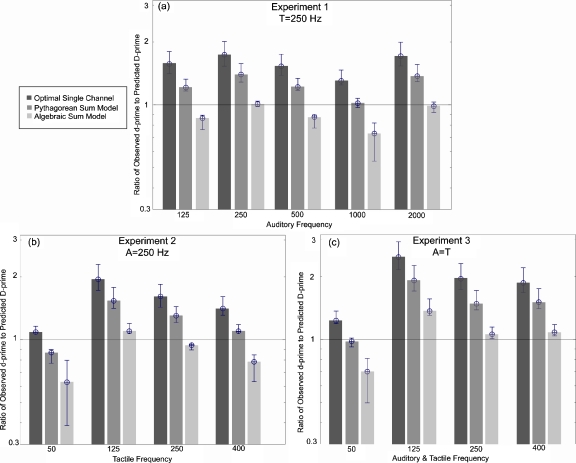
Figure 5.
Ratio of the observed d′ values to the Predicted D′ values for each of the three models averaged across subjects and repetitions of each experimental condition. (a) Ratios for Experiment 1, in which the tactile frequency=250 Hz and the auditory frequency was varied between 125 and 2000 Hz. (b) Ratios for Experiment 2, in which the auditory frequency=250 Hz and the tactile frequency was varied between 50 and 400 Hz. (c) Ratios for Experiment 3, in which the auditory and tactile frequencies were equal and covaried between 50 and 400 Hz. The horizontal bar on each graph indicates a ratio of 1.0 (i.e., observed=predicted values). The dark gray bars represent the optimal single channel model, the gray bars represent the Pythagorean sum model, and the light gray bars represent the Algebraic sum model. Error bars are 1 SEM.

