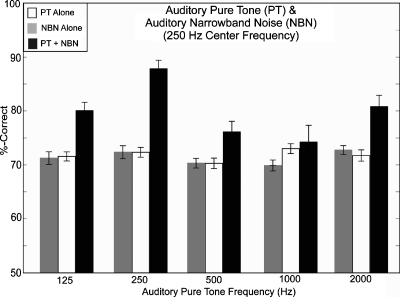
Figure 6.
% correct scores averaged across four subjects and four repetitions per condition. Scores are shown for auditory PTs alone (white bars), auditory NBN alone (light gray bars), and for combined PT+NBN (dark gray bars). Scores are shown as a function of auditory PT frequency with NBN centered at 250 Hz and bandwidth of 48 Hz. Error bars are 1 SEM.

