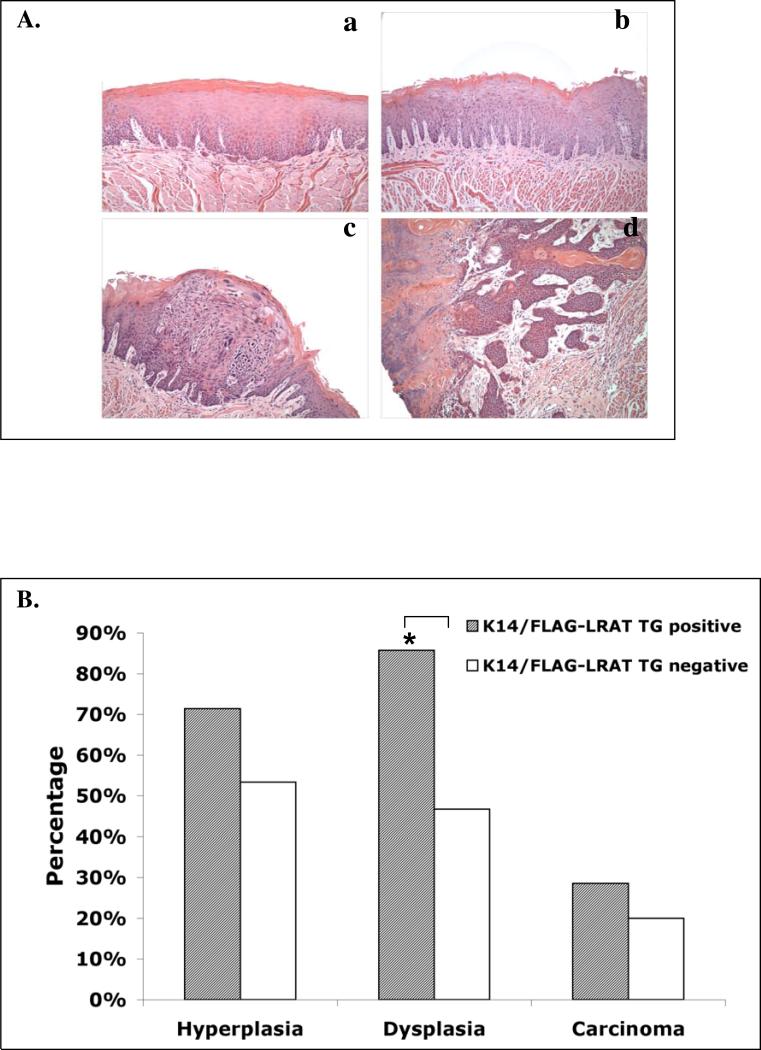
Figure 3. Pathological evidence of carcinogenesis in mouse tongues after carcinogen treatment.
K14/FLAG-hLRAT TG positive and negative mice were treated with 4-NQO (100 μg/ml) in drinking water (see “Materials and Methods”) for 10 weeks and then maintained for another 15 weeks. The mice were sacrificed, and the tongues were fixed, embedded, sectioned, and stained with H&E. A, representative pictures of pathology (200 ×): a, hyperplasia with marked hyperkeratosis; b, mild dysplasia; c, severe dysplasia / carcinoma in situ; d, invasive carcinoma with tumor cells invading the skeletal muscle fibers of the tongue. B, Percentage of mouse tongue samples (each sample was from a different mouse) at different carcinogenesis stages. The data were analyzed by using a Fisher's exact probability test. Differences with a p value of < 0.05 (marked with an asterisk) were considered to be statistically significant.

