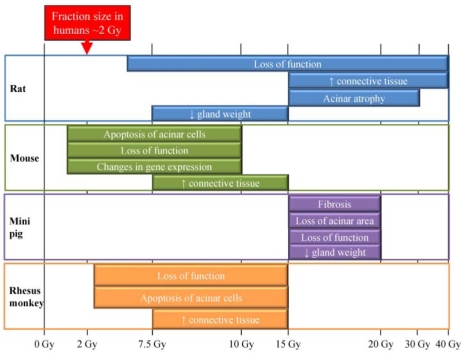
Figure 2.
Comparison of radiation responses in animal models following a single dose. The typical fraction size (~ 2 Gy) in affected individuals is provided at the top as a reference for the other models. Physiological, molecular, and histological changes are graphed relative to the single radiation dose evaluated in the rat, mouse, miniature pig, and rhesus monkey models (Stephens et al., 1986a,b, 1991; Vissink et al., 1990; Nagler, 1998; Nagler et al., 1998; Paardekooper et al., 1998; Bralic et al., 2005; Konings et al., 2005a, 2006; Li et al., 2005; Humphries et al., 2006; Limesand et al., 2006; Muhvic-Urek et al., 2006;Takakura et al., 2007; Avila et al., 2009).

