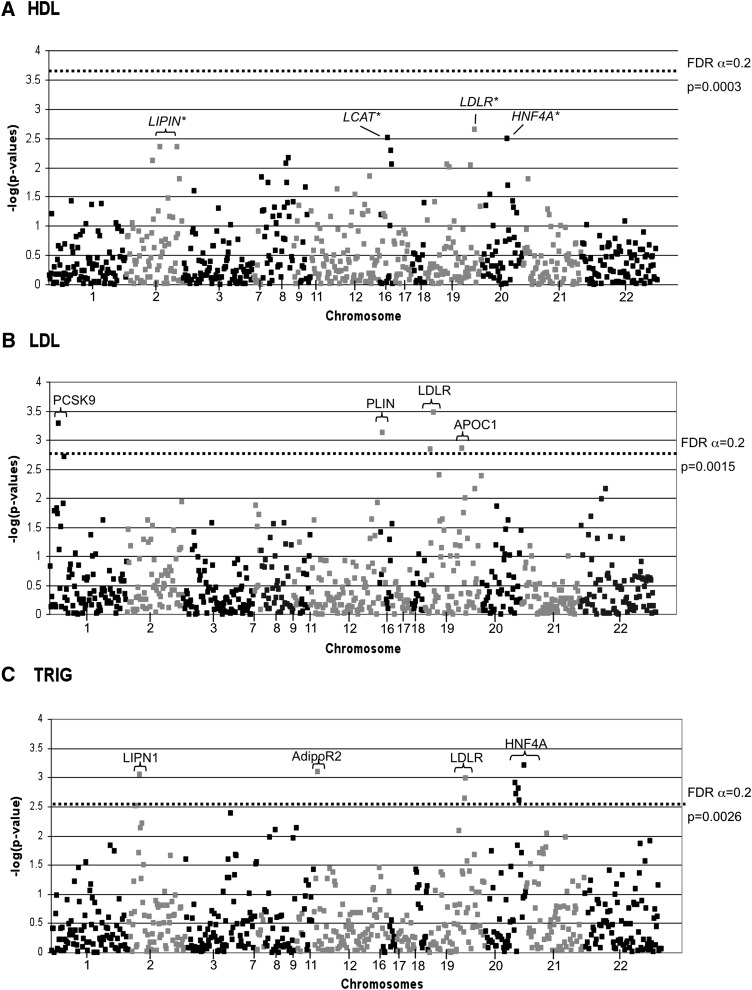
Fig. 1.
Association results are presented for HDL (A), LDL (B), and TRIG (C). The -log of the P-value is presented on the y axis and SNPs are presented across the x axis in order of chromosome position. The dashed lines in B and C represent the P-value for significant SNPs and gene symbols are presented for those SNPs. No SNPs in HDL were associated beyond the FDR threshold, and the dashed line in A represents the level of significance, which would have been needed. Top HDL findings are indicated in A.

