
Figure 12. Examples of binding regions and their positions relative to PONDR®predicted order.
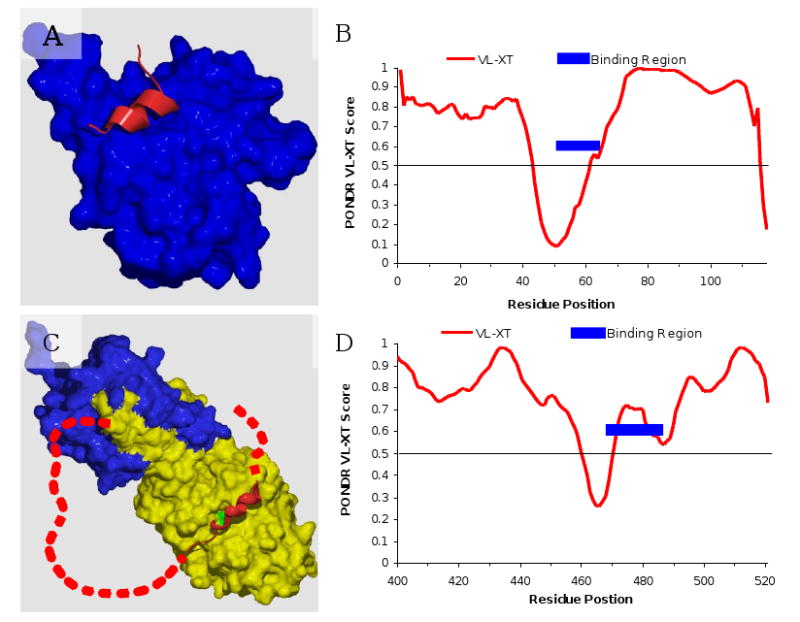
A. Eukaryotic initiation factor (blue) and the binding region of 4EBP1 (red). B. The PONDR® VL-XT prediction for 4EBP1 with the binding region designated (blue bar). C. The B (blue) and A (yellow) subunits of calcineurin and the autoinhibitory region of the A subunit (red helix) in the midst of observed disordered sequence (red dashes). D. The PONDR® VL-XT prediction for the last 121 amino acid residues of the A subunit with the autoinhibitory region indicated (blue bar). Modified from [114].