
Figure 14. Druggable p53–Mdm2 interaction.
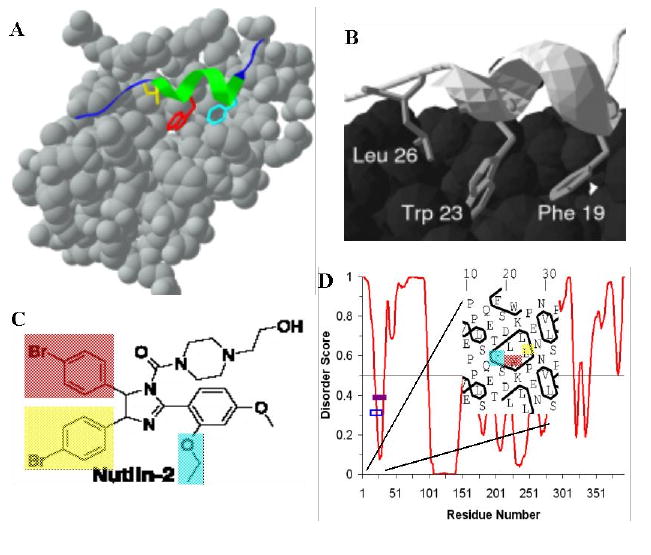
Protein disorder features and small molecule design. The p53 peptide (in color) bound to Mdm2 (PDB 1YCR, in gray scale) is shown in (A). Close-up view of p53 (ribbon) bound to Mdm2 (globular). The side chains of p53's crucial residues for the interaction (Phe 19, Trp 23, Leu 26) are shown (B). Notice that residues Phe19, Trp23 and Leu26 of p53 are pointing into the Mdm2 binding pocket. By comparison, the small molecule nutlin-2, designed to mimic the side chains of the residues from p53 is shown in (C). The PONDR® VL-XT plot of p53 is shown in (D), which indicates that this fragment of p53 might undergo disorder-to-order transition upon binding to Mdm2. The purple bar represents the predicted α-MoRF region (α-helical molecular recognition feature) [114, 116], the hollow box represents the determined binding region, which shows a good agreement between the two. Hydrophobic cluster analysis of binding region is shown. Figure is modified from [364].