
Figure 2. Peculiarities of amino acid composition of ID proteins.
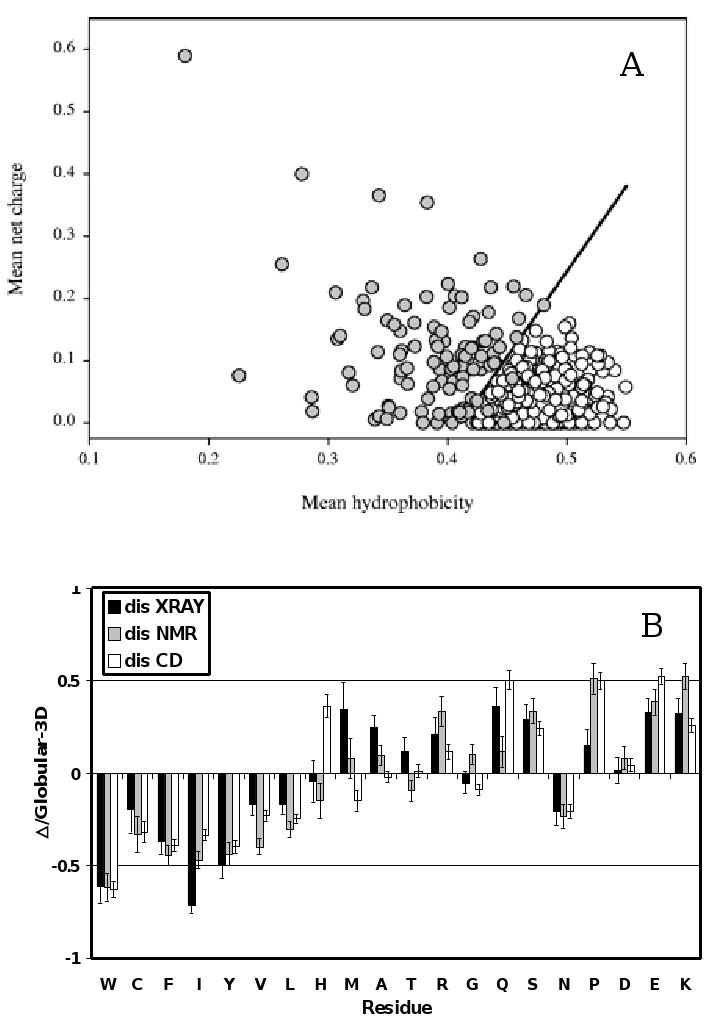
A. Comparison of the mean net charge and the mean hydrophobicity for a set of 275 folded (open circles) and 91 natively unfolded proteins (gray circles). The solid line represents the border between intrinsically unstructured and native proteins (see text). B. Order/Disorder composition profile. Comparisons of amino acid compositions of ordered protein with each of three databases of disordered protein. The ordinates are (% amino acid in disordered dataset - % amino acid in ordered dataset) / (% amino acid in ordered dataset) = Δ/globular_3D. The residues are ordered according to the Vihinen's flexibility scale [105]. Names of each database indicate how the disordered regions were identified. Negative values indicate that the disordered database has less than order, positive indicates more than order.