
Figure 4. Binary predictors of intrinsic disorder.
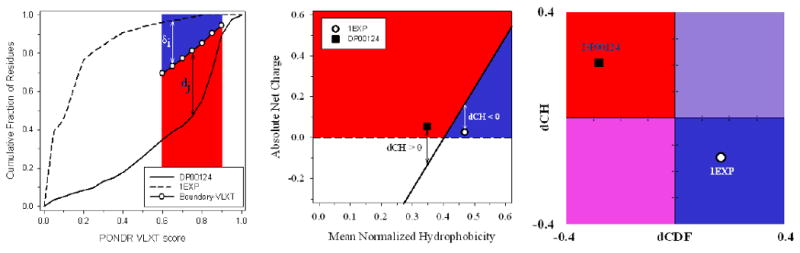
A. CDF analysis. Dashed curve located above the boundary represents CDF curve of ordered protein, whereas solid line located below the boundary corresponds to the CDF curve of IDP. Here, δi and dj (where i and j range from 1 to 7) are attributed to the ordered and disordered protein, respectively, and represent the distances of points at the CDF curve from the corresponding boundary points. The averaged distance of a given CDF curve from a boundary line is calculated as or . B. CH-plot analysis. Black square located above the boundary corresponds to ordered protein, open circle located below the boundary represents disordered protein. C. CH-CDF analysis. Black square corresponds to disordered protein DP00124, whereas open circle represents ordered protein 1EXP. X-coordinates were calculated as averaged distances of corresponding CDF curves from a boundary (positive dCDF distance corresponds to a protein predicted to be ordered by CDF analysis, negative dCDF distance corresponds to a protein predicted to be disordered by CDF analysis, see plot A). Y-coordinates were obtained as distances from spots corresponding to proteins to boundary. Positive and negative dCH distances correspond to protein predicted by CH-plot to be disordered or ordered, respectively, see plot B.