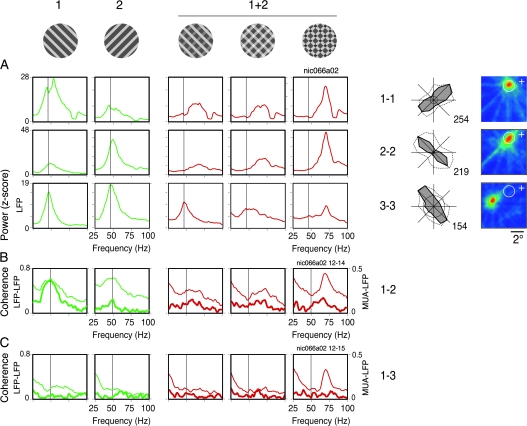
Figure 9.
Relations between synchrony and stimulus coherence for recordings obtained from different electrodes (e.g., from Monkey 1). Data shown were obtained for 3 sites recorded simultaneously in area V1 (RF maps are shown to the right, conventions as in Fig. 7). Neurons recorded in the operculum (electrodes 1 and 2, ∼3° eccentricity) had overlapping RFs, whereas the RFs of neurons recorded in the calcarine (electrode 3, ∼10° eccentricity) were nonoverlapping with those recorded from the operculum. Tuning curves for direction of movement are presented to the left of the RF maps (conventions as in Fig. 1), both for gamma of the LFP (dotted line) and for the spiking responses (solid line). The stimulus used for each condition is shown at the top of each respective column. Direction of motion of components 1 and 2 of the plaids were chosen in accord with the tuning properties of the neurons (component 1 matching the properties of electrode 1 and component 2 matching the properties of electrodes 2 and 3). Plaid stimuli (1 + 2) were displayed in the following configurations: depth-ordered, transparent, and pattern plaids (columns from left to right). Depth-ordered and transparent plaids had physical properties compatible with perception of noncoherent motion, whereas the pattern plaid was compatible with perception of coherent motion. (A) Spectral power of the LFP (z-score) computed for each condition and recording site. (B) LFP–MUA coherence (thick curves) and LFP–LFP coherence (thin curves) computed for the pair of overlapping RF sites (1–2). (C) As in (B), but for one pair of nonoverlapping RF sites (1–3). From a total of 5 cases studied in 2 monkeys, all showed similar results.

