Figure 6.
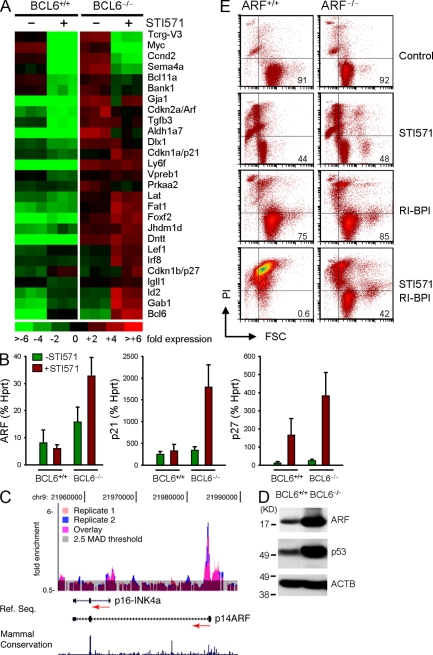
BCL6 promotes pre–B cell survival by negative regulation of ARF. (A) BCR-ABL1–transformed BCL6+/+ and BCL6−/− pre–B cells were induced to differentiate (10 µmol/liter STI571) and studied by microarray analysis. Genes were sorted based on the ratio of gene expression values in STI571-treated BCL6+/+ compared with BCL6−/− pre–B cells. (B) Differences in mRNA levels of checkpoint genes (ARF, p21, and p27) were verified by quantitative RT-PCR using HPRT as a reference (mean values ± SD; n = 3). (C) Recruitment of BCL6 to the genomic region of the CDKN2A locus (ARF) was verified by ChIP-on-chip analysis and confirmed by single locus QChIP analysis (n = 3). BCL6–DNA complexes were immunoprecipitated using an anti-BCL6 polyclonal antibody. ChIP products and their respective input genomic fragments were amplified by ligation-mediated PCR. QChIP was performed again at this stage for selected positive control loci to verify that the enrichment ratios were retained (not depicted). The genomic products of two biological ChIP replicates were labeled with Cy5 (for ChIP products) and Cy3 (for input) and cohybridized on genomic tiling arrays including the genomic region of the CDKN2A locus (Chr9:21,950629–22,003329). After hybridization, the relative enrichment for each probe was calculated as the signal ratio of ChIP to input. Peaks of enrichment for BCL6 relative to input were uploaded as custom tracks into the University of California, Santa Cruz genome browser and graphically represented as histograms. Peaks involving five or more oligonucleotide probes above threshold (2.5-fold SD above average enrichment) were considered positive. (D) To determine whether recruitment of BCL6 to the Arf (CDKN2A) promoter affects expression levels of proteins in the Arf–p53 pathway, BCR-ABL1–transformed BCL6+/+ and BCL6−/− pre–B cells were analyzed by Western blotting. (E) BCR-ABL1–transformed pre–B cells from ARF+/+ and ARF−/− mice were induced to differentiate (+STI571) or cultured under control conditions in the presence or absence of 5 µmol/liter of a peptidomimetic BCL6 inhibitor (RI-BPI; Cerchietti et al., 2009). Cell size (FSC) and viability (propidium iodide uptake) were measured by flow cytometry after 1 and 3 d (n = 3). Percentages of viable cells are indicated for each condition. FSC, forward scatter; PI, propidium iodide.

