Figure 3.
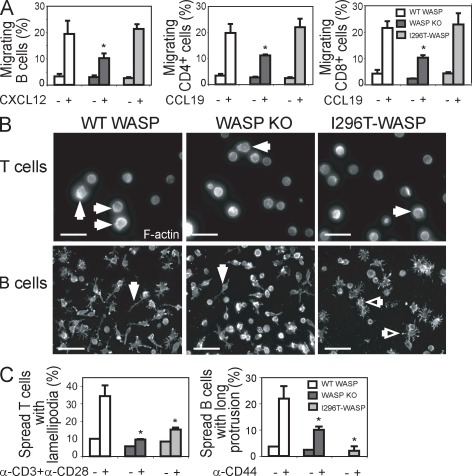
Normal migratory response but reduced spreading of WASP-L272P and WASP-I296T B and T cells. (A) Migration. Spleen B or T cells were allowed to migrate to CXCL12 or CCL19 for 3 h using an in vitro chemotaxis chamber. Migrating cells were collected and enumerated by flow cytometry with reference beads. The percentage of migrating cells is shown as mean values (±SD) of triplicate wells and is representative of at least three experiments. *, P < 0.05 compared with WT. (B) Spreading. (top) Spreading of T cells was assessed on anti-CD3 plus anti-CD28 antibody–coated surfaces. Closed white arrows depict the formation of large sheet-like lamellipodia of spread T cells. Bars, 25 µm. (bottom) Spreading of activated B cells was assessed on anti-CD44 antibody–coated surfaces. Closed white arrows depict the formation of long protrusions of spread B cells and open white arrows depict spread cells with many short protrusions. Bars, 40 µm. (C) Graphs show the mean of relative numbers (±SD) of spread T (left) and B cells (right) in triplicates and are representative of three experiments. *, P < 0.05 compared with WT.

