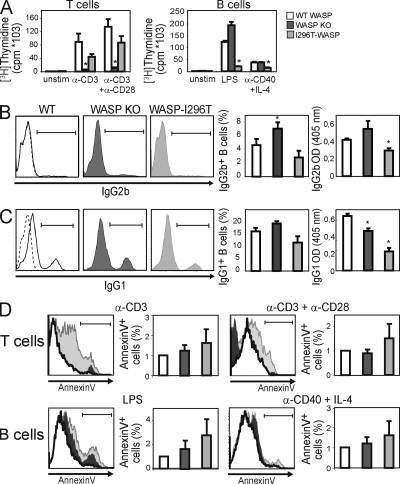
Figure 4.
WASP-I296T reduces the proliferative response of B cells, but not T cells, and leads to modestly increased apoptosis. (A) Proliferation. Spleen T (left) and B cells (right) were stimulated for 48 h with the indicated stimulus followed by a 16-h pulse with [3H]thymidine to determine the proliferative response. Bars are representative mean values of cpm ([3H]thymidine) ± SD of triplicate wells from one of at least three independent experiments. *, P < 0.05 compared with WT. (B and C) Spleen B cells were stimulated with LPS (B) and anti-CD40 plus IL-4 (C) for 96 h and assessed for IgG2b (B) and IgG1 (C) class switching by intracellular staining and antibody secretion by ELISA. Each panel shows one representative histogram (left) and one graph of mean values (±SD) of three different mice (middle). The dashed lines in the WT histograms (left) indicate the isotype control. Graphs (right) show secretion of IgG2b (B) and IgG1 (C) by ELISA. Each graph represents mean values (±SD) of three different mice. B and C represent one out of two similar experiments. *, P < 0.05 compared with WT. (D) Apoptosis. Spleen T and B cells were stimulated with the indicated stimulus for 72 h. The percentage of apoptotic cells was assessed after labeling with 7AAD and annexin V and flow cytometric analysis. Apoptotic cells were defined as annexin Vhigh7AADlo. Each panel shows one representative histogram (left) and one graph of mean values (±SD) of three or more experiments (right). In each case, although there were statistically significant differences (P < 0.05) in apoptosis between WASP-I296T cells when compared with WASP-WT in most individual experiments, because of the variability, statistical significance was not met when compiling all experiments.

