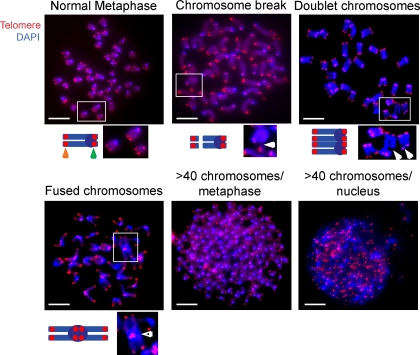
Figure 5.
Increased genomic instability in WASP-I296T B and T cells. (A) Examples of cytogenetic abnormalities observed in WASP-I296T B and T cells. DAPI-stained chromosomes are blue, with the centromeres being visualized as more intense blue ovals. Red dots come from telomere signals. The top left micrograph depicts a normal metaphase with 40 chromosomes, each consisting of two sister chromatids and four telomeres. The schematic drawing represents one chromsome with two sister chromatids. The orange arrow denotes telomeres at the long arms and the green arrow denotes telomeres on the short arms of the chromatids. Insets show higher magnification of boxed areas to highlight normal and altered chromosomes. The other micrographs depict representative chromosomal abnormalities including chromosomal breaks (top middle micrograph), doublet chromosomes with breaks (top right micrograph), a fused chromosome (bottom left micrograph), a metaphase with >40 chromosomes (bottom middle micrograph), and a nucleus with >40 chromosomes, i.e., >160 telomeres (bottom right micrograph). Closed white arrowheads in the magnified images beneath the micrographs denote chromosomal breaks. The open white arrowhead denotes two fused chromosomes with a large centromere. Bars, 2 µm.

