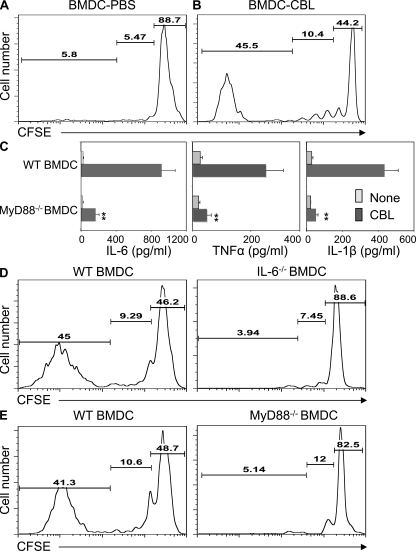
Figure 4.
Microbiota stimulation of DC IL-6 production via Myd88 pathway promotes T cell spontaneous proliferation. BMDCs generated from B6 mice were pulsed with PBS or 100 µg/ml of CBLs for 24 h. 106 CFSE-RAG−/−.OT II CD4+ T cells were transferred together with 106 PBS-pulsed BMDCs (A) or with CBL-pulsed BMDCs (B) into germfree RAG−/− mice. 10 d after the transfer, division of the CFSE-labeled CD4+ T cells was determined by flow cytometry. Numbers in each plot represent the percentage of donor cells undergoing spontaneous proliferation, homeostatic proliferation, and staying undivided, respectively. (C) BMDCs generated from B6 mice or B6.Myd88−/− mice were stimulated with 100 µg/ml of CBL for 24 h. To determine IL-1β production, 2 mM ATP was added in the last 10 min of the culture. IL-6, TNF, and IL-1β production in the supernatant was determined by ELISA. **, P < 0.01 compared with WT DCs. (D) 106 CFSE-RAG−/−.OT II CD4+ T cells were transferred together with 106 CBL-pulsed B6.BMDCs or CBL-pulsed B6.IL-6−/− BMDCs into germfree RAG−/− mice. (E) 106 CFSE-RAG−/−.OT II CD4+ T cells were transferred together with 106 CBL-pulsed B6.BMDCs or CBL-pulsed B6.Myd88−/− BMDCs into germfree RAG−/− mice. 10 d after the transfer, division of the CFSE-labeled CD4+ T cells was determined by flow cytometry. Numbers in each plot represent the percentage of donor cells undergoing spontaneous proliferation, homeostatic proliferation, and undivided, respectively. Data are representative of at least four mice of each group from two independent experiments.

