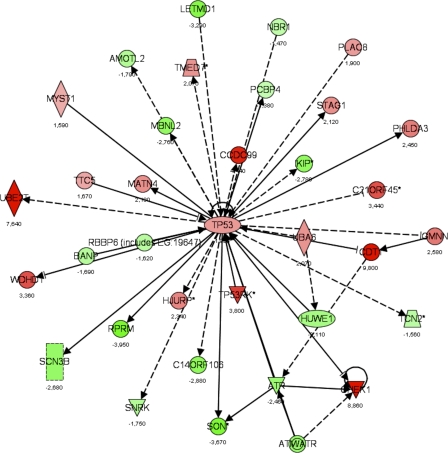
Figure 9.
Gene interaction networks affected by loss of Tob1. A dataset of genes regulated in the Tob1-null mice (LCB > |1.2|), but not in WT mice, was used to determine how loss of Tob1 affects gene expression after 2/3 hepatectomy. From this gene list input, a score was determined that ranks networks according to how relevant they are to the genes in the input dataset (see Results). The score for the p53 network was 34, the negative exponent of the p-value (P = 10−34), and this network is shown here. Each gene is given a heat map color that corresponds to the degree of regulation; reds are increased and greens are decreased, both in proportion to the intensity of the color. Numbers represent fold change. Shapes denote function as follows: trapezoids, transporters; diamonds, enzymes; ovals, transcription regulators; triangles, kinases; rectangles, ion channels; double circles, complex; circles, other. Arrows denote the first molecule acts on the second, and perpendicular lines denote the first inhibits the second. Solid lines are direct interactions, and dashed lines are indirect interactions. Data are from two distinct chips, each with three different animals.

