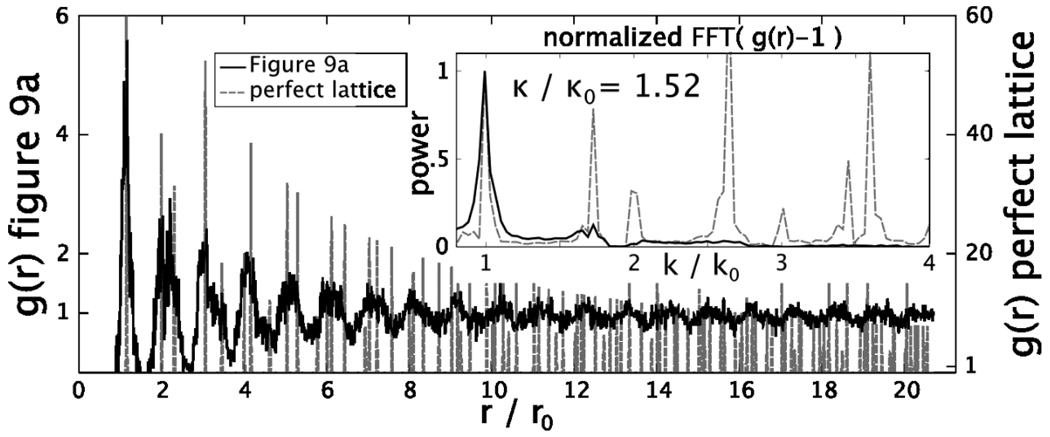
Figure 10.
Calculated pair correlation function (PCF) from sample shown in Fig. 9a and PCF for a perfect lattice (vertical dashed lines) as a function of r/ro, where ro is the mean near neighbor center to center spacing. The inset shows the Fourier Transforms (FT) of both PCF where the dotted lines show the FT of the perfect lattice.

