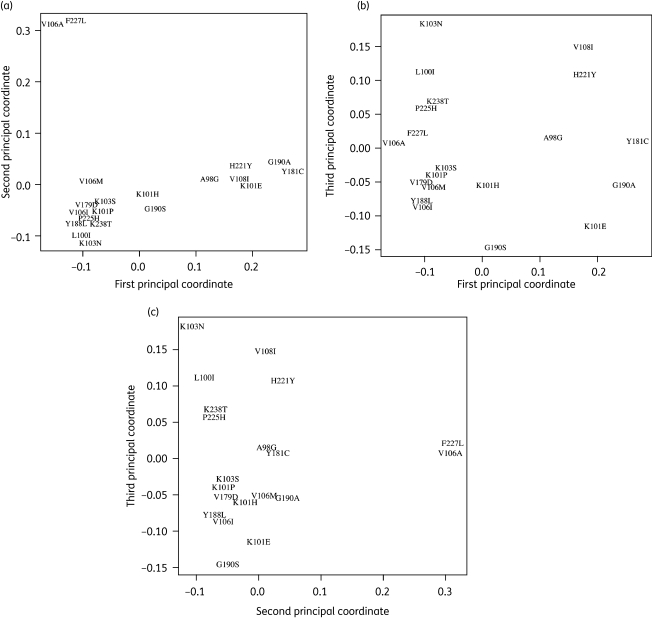
Figure 2.
Multidimensional scaling of NNRTI-selected mutations. This figure is a 2-D projection of the distances among 21 of the 22 mutations occurring in significantly covarying pairs (corrected P < 0.05, Table 1) in sequences containing at least one NNRTI-selected mutation: (a) compares the first and second principal coordinates; (b) compares the first and third principal coordinates; (c) compares the second and third principal coordinates. The distance between any two mutations is measured by their Jaccard dissimilarity coefficient, JD, where JD is equal to 1 minus the Jaccard similarity coefficient. The R command cmdscale was used to compare the first three principal coordinates from a table of JDs for each pairwise comparison. V179F is not included in this graphic; despite a significant positive correlation with Y181C, the comparison produces a high Jaccard dissimilarity coefficient, causing a misleading placement in multidimensional scaling.

