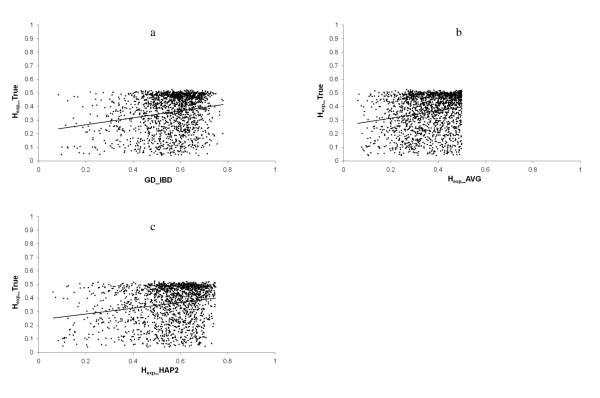
Figure 4.
a, b, c - Relationship between the true genetic diversity (Hexp_TRUE) and estimated genetic diversities. (a) by IBD probabilities between marker haplotypes (GD_IBD); (b) by expected heterozygosity as an average for the two flanking markers (Hexp_AVG); (c) by expected heterozygosity for the two flanking markers as a two marker haplotype (Hexp_HAP2).

