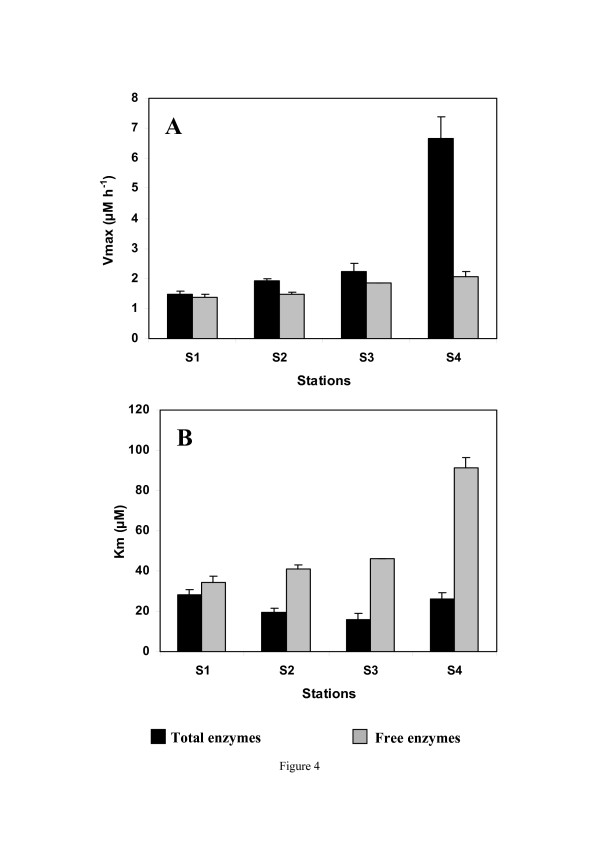
Figure 4.
Aminopeptidase activity along the salinity gradient. (A) maximum enzymatic velocity, Vmax (μM h-1), and (B) affinity with the substrate, Km (μM) from S1 to S4. Total enzymatic and free enzymatic activities are shown in black and grey, respectively. The error bars represent the standard deviations.

