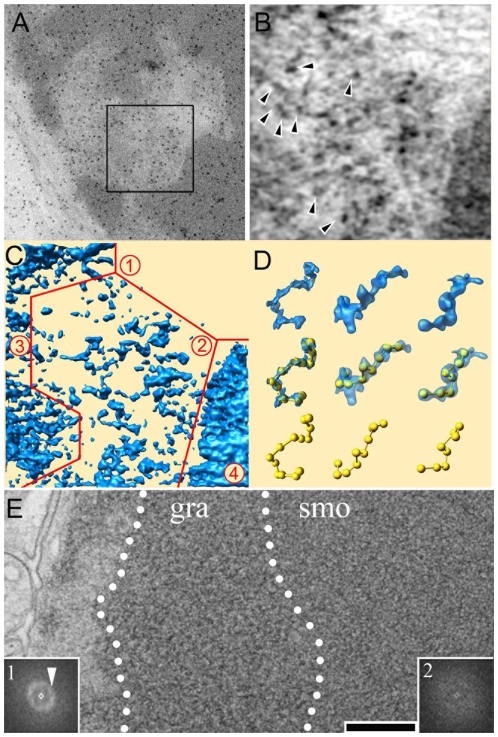
Figure 2. Electron tomography of rod photoreceptor nuclei.
(A) Overall view of the nuclear domain in which the electron tomogram was recorded (boxed area). The dark gold beads are fiducial markers used for aligning the tilted views on a common origin (B) Four nm thick section through the tomogram showing dark electron dense particles (arrows). (C) Surface representation of the tomogram in which 4 distinct chromatin domains were delineated. (D) Extraction of characteristic 11 nm fibers from different tomograms and beads on a string representation. (E) Overall view of the heterochromatin domain showing a distinct transition between a granular (gra) and a smooth (smo) compartment. These compartments are characterized by their optical diffraction pattern shown in insert 1 and 2 for the granular and smooth territory respectively. Bar represents 300nm in (A), 100 nm in (B–C), 54 nm in (D) and 230 nm in (E).

