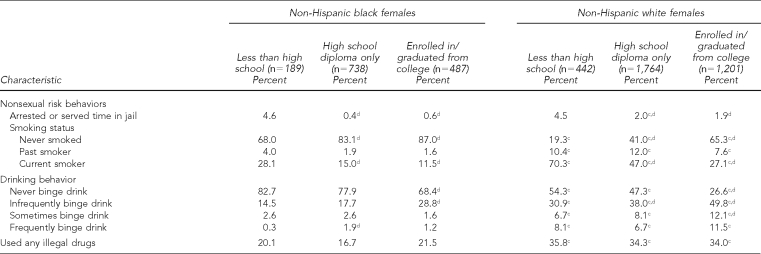
Table 1.
Sample characteristics by race and educational status, National Longitudinal Study of Adolescent Health (Add Health), Wave III, 2001–2002 (n=4,821), weighted dataa,b
aVariables are dummy coded and can be interpreted as percents, unless otherwise noted. Chi-square tests were used to test for significance with categorical and dichotomous variables. Two-sided t-tests were used to test for significance with continuous variables.
bAll estimates are weighted to adjust for the complex sampling design of Add Health and for nonresponse.
cSignificant (p<0.05) race differences within educational status (reference = white)
dSignificant (p<0.05) educational differences within race (reference = less than high school)
eSample size for Chi-square tests of STI assay diagnosis was 4,045. All other covariates used larger sample size based on self-reported STI diagnosis (n=4,821).
STI = sexually transmitted infection


