Figure 6.

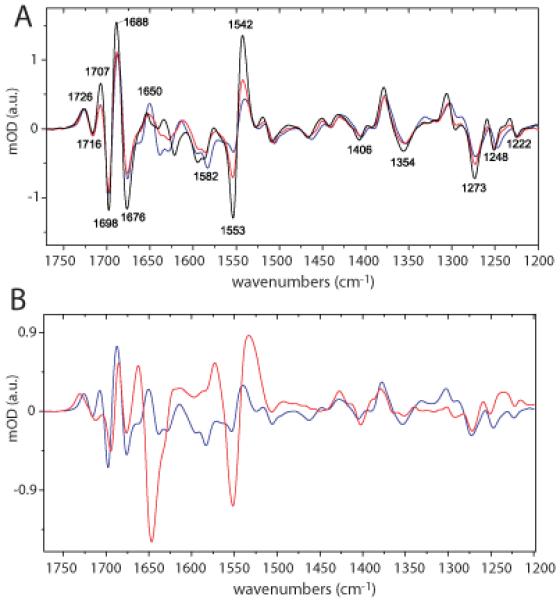
(A) Low temperature FTIR light minus dark spectra recorded at 150 (black), 200 (red) and 300 K (blue). (B) Comparison of light minus dark FTIR spectrum of LovK (blue line) with Phot1-LOV2 (red line) at 300K.

(A) Low temperature FTIR light minus dark spectra recorded at 150 (black), 200 (red) and 300 K (blue). (B) Comparison of light minus dark FTIR spectrum of LovK (blue line) with Phot1-LOV2 (red line) at 300K.