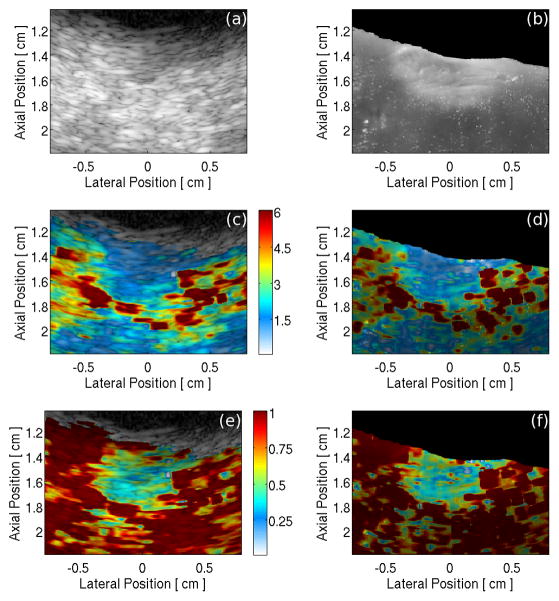
Fig. 3.
(a) B-mode image and (b) digital image of a RFA lesion sliced along the 30° imaging plane. Image of maximum ARFI-induced displacement overlaid onto: (c) the B-mode image and (d) the digital photograph of the lesion cross-section. Depth normalized maximum ARFI-induced displacement data overlaid onto: (e) the B-mode image and (f) the digital image of the lesion cross-section. The color bar units in (c) and (d) are μm displacement away from the transducer; in plates (e) and (f) the colors represent the fraction of the maximum displacement at a given depth.

