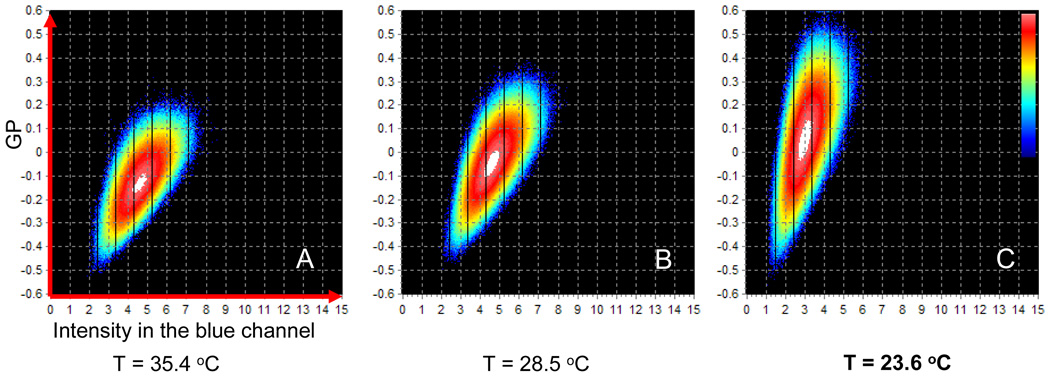
Figure 4.
Time evolution of circular scanning 2D histograms of GP vs Intensity in the blue channel. As the temperature is decreased the center of the GP distribution changes from −0.13 at 35.4C to 0.05 at 23.6C. simultaneously with this change, the average intensity also decreases form 5.5 counts at 35.4C to 3 counts at 23.6C. The scale on the z-axes (frequency of counts) is logarithmic. The color scale is shown in image c.

