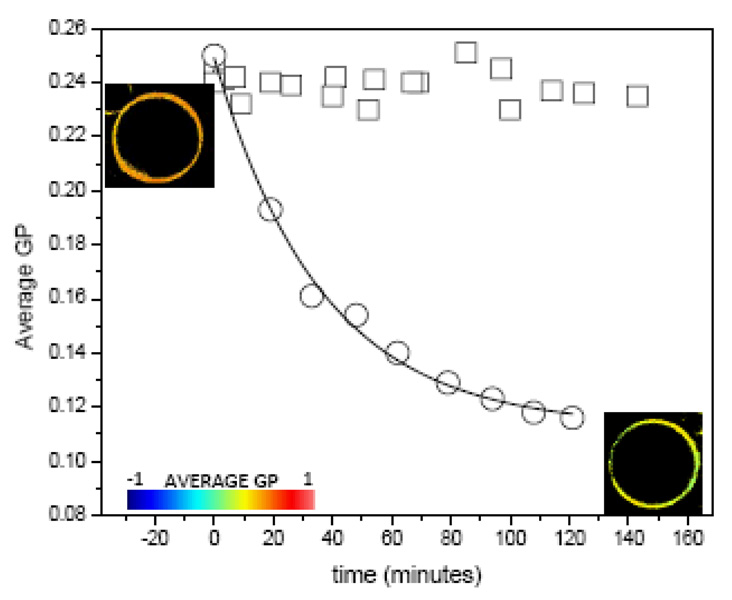
Figure 4.
Kinetics of cholesterol removal by particles of 96Å of wild type apoA-I rHDL (circles) [69] and of the mutant H1@H4 (squares) at 36.5°C from POPC-30% cholesterol GUVs. Solid line for the opened circles symbols corresponds to a first order exponential decay fit with a time constant of 39.3+/−0.1. GP images of the GUV at the beginning (top left) and end (bottom right) of the incubation time are also shown and colored according to the GP scale going from −1 to 1.

