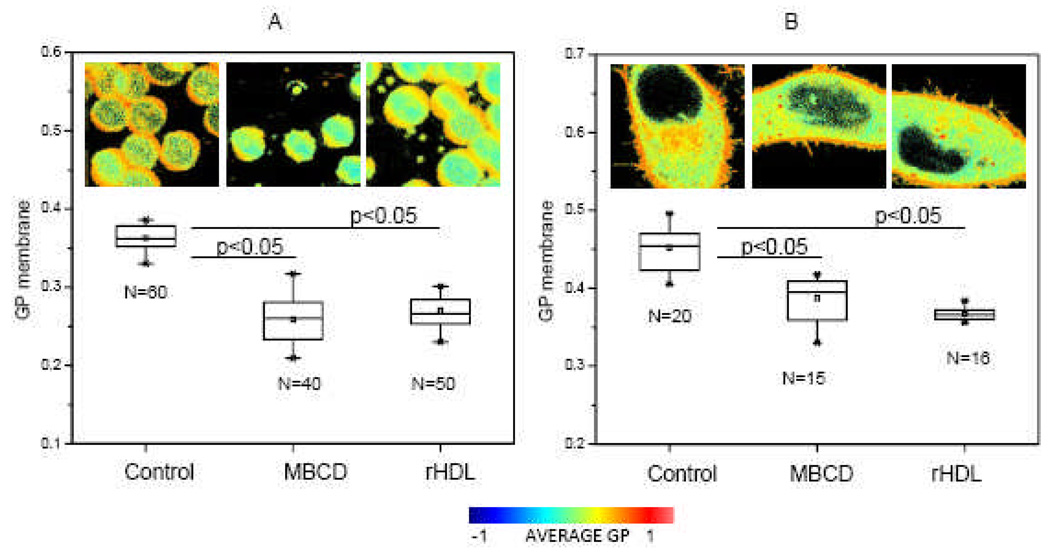
Figure 8. Effect of cholesterol acceptors on the GP membrane of alive cells.
[A] GP membrane values for human erythrocytes in buffer (Control), incubated with MβCD 3.5mM for 120 min, and incubated with 96Å rHDL 300 µg/ml for 2h. Buffer used: 10mM Phosphate, 147 mM NaCl, 3 mM KCl, pH 7.4. [B] GP membrane values for HeLa cells in culture media (Control), incubated with MβCD 10 mM for 60 min and incubated with 96Å rHDL 300µg/ml for 2h. Temperature for all the experiments was 37°C and N corresponds to the number of cells analyzed. ANOVA test was performed to compare the control data and the data after incubation with the cholesterol acceptors. Results show a significant difference with p<0.05. Images presented correspond to the complete GP image. Palette shows the color scale used for all the images.

