
Fig. 2.
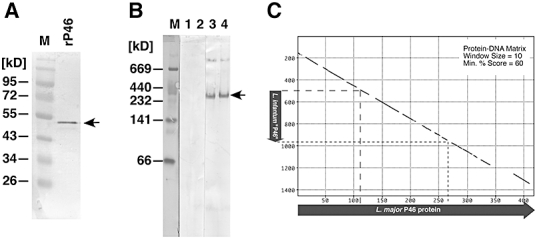
Characterization of ORF 4. A. Western blot of recombinantly expressed 46 kD protein probed with anti-P46 antiserum. Marker bands are annotated; arrow indicates the recognized 46 kD protein band. B. Native gradient gel electrophoresis and Western blot. Promastigotes of L. major (lanes 1, 3) or L. major[pcosP46] (lanes 2, 4) were lysed under non-denaturing conditions, and the lysates were separated by pore gradient gel electrophoresis. Following Western transfer, the membranes were probed either with naive mouse serum (lanes 1, 2) or with anti-P46 serum (Lanes 3, 4). The marker lane (M) blot was stained with Coomassie Brilliant Blue. Marker protein positions are indicated to the left. The arrow points at the major P46-specific band. C. Protein-DNA matrix plot (Pustell, Mac Vector™ Suite) of L. major P46 amino acid sequence against the corresponding region of the L. infantum genome (CHR 33, position 1 371 444–1 372 905). The blue arrows show the relative extent of the open reading frames; plot parameters are given in the top right corner. Extent of the L. infantum open reading frame relative to the L. major sequence in indicated (dotted lines).