Figure 1.

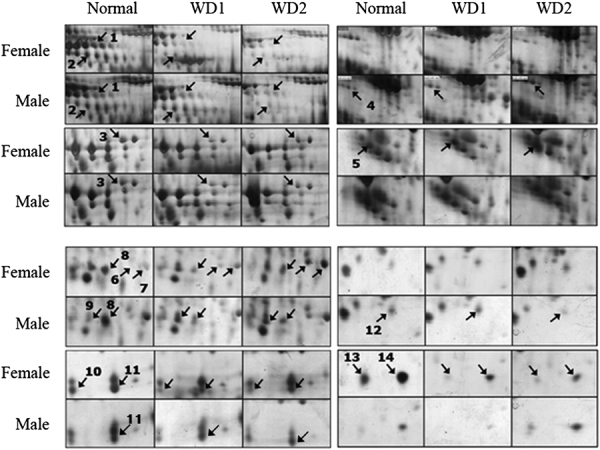
Partial 2-DE comparison images of normal subjects and asymptomatic WD patients. Differentially expressed proteins displaying >2-fold difference in levels are indicated with numbered arrows.

Partial 2-DE comparison images of normal subjects and asymptomatic WD patients. Differentially expressed proteins displaying >2-fold difference in levels are indicated with numbered arrows.