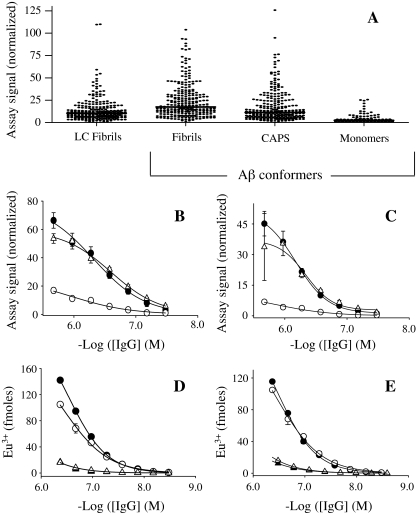
Fig. 2.
EuLISA screen of LC fibril and Aβ conformer binding by IgGs contained in 260 donor plasma samples. a Comparison of amyloidogenic conformer IgG binding using a 1:20 dilution of plasma. Solid lines represent the median values, which with the exception of the median value for binding to LC fibrils compared with that for CAPS, significantly differed (P < 0.0001 in a nonparametric Kruskal–Wallis test). To eliminate plate-to-plate variability, assay signals were normalized using a standard curve constructed from coagulation reference plasma. b–c Antibody binding curves for high (filled circle) and low (unfilled circle) reactive plasma pools and for an equimolar mix (unfilled triangle) against Aβ fibrils (b), and CAPS generated from the 40-mer Aβ peptide (c). Similar binding curves to those shown in (b) and (c) were also determined for the latter plasma pools against LC fibrils and CAPS generated from Aβ42 (data not shown). Each plasma pool consisted of 20 plasma specimens. d Binding curves for purified plasma IgGs from the high (filled circle) and low (filled triangle) reactive plasma pools against LC fibrils compared with curves generated using the respective plasma (unfilled circle, unfilled triangle). e Antibody binding curves for essentially the same reagents described in (d), but each antibody sample was pretreated with acid and dialysis (m.w. cutoff of 30,000 Da), and then neutralized to remove any putative inhibitor of antibody–amyloidogenic conformer interactions. CAPS indicates dityrosine cross-linked β-amyloid protein species, LC human Ig light chain

