
Fig. 2.
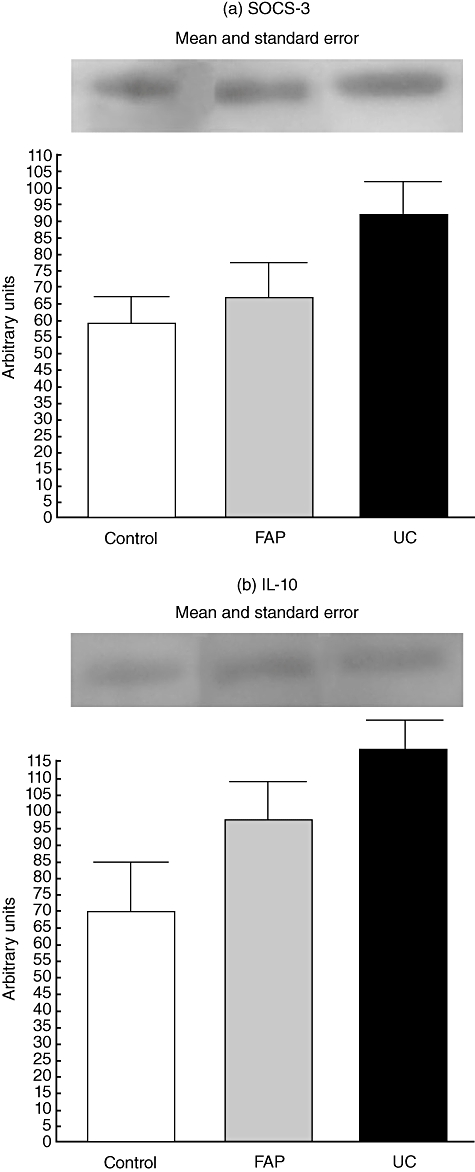
Expression of interleukin (IL)-10 and suppressor of cytokine signalling (SOCS-3) in control, familial adenomatous polyposis (FAP) and ulcerative colitis (UC) groups. For illustration purposes each line band represents one patient. For all conditions, n = 09, FAP*versus control, P < 0·05; UC§versus FAP, P < 0·05.