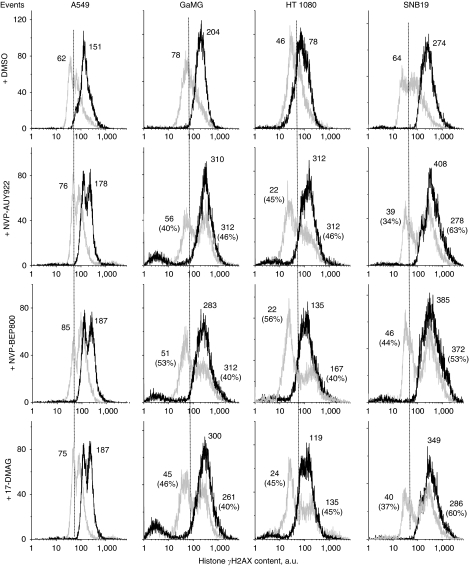
Figure 5.
Typical distributions of nuclear histone γH2AX in four tumour cell lines detected 30 min after irradiation with 8 Gy, and after a combined drug-ionising radiation (IR) treatment. Cells were stained with anti-histone γH2AX and analysed by flow cytometry using logarithmic amplification mode. Numbers denote the mean histone γH2AX expression for the respective cell sub-population and the percentage of cells in the sub-population. Black and light grey histograms represent irradiated and non-irradiated cells, respectively. To facilitate visual comparison, the modal γH2AX values in the DMSO-treated and irradiated sample are indicated by dashed vertical lines.

