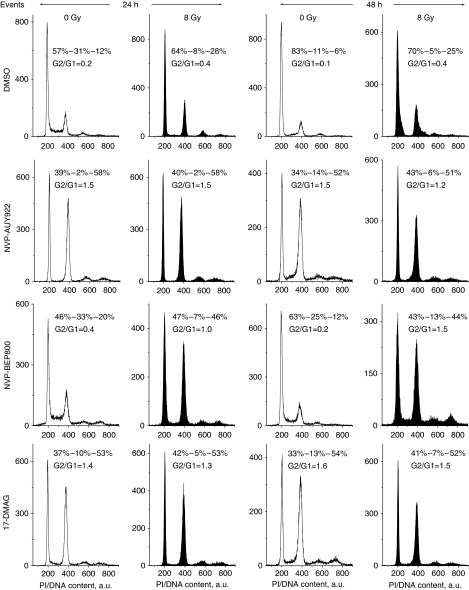
Figure 7.
Effects of Hsp90 inhibitors, ionising radiation (IR) and combined drug-IR treatment on the cell cycle-phase distribution in the A549 cell line. Cells were treated with drugs and/or irradiated with 8 Gy, cultured for 24 or 48 h, fixed, permeabilised, stained with propidium iodide (PI) and analysed for DNA content by flow cytometry using linear signal amplification. DNA histograms were deconvoluted with ModFit Software. Numbers denote the percentage of cells in G1, S and G2/M phases and G2/G1 ratios in each cell sample. Filled and unfilled histograms represent irradiated and non-irradiated cells, respectively.

