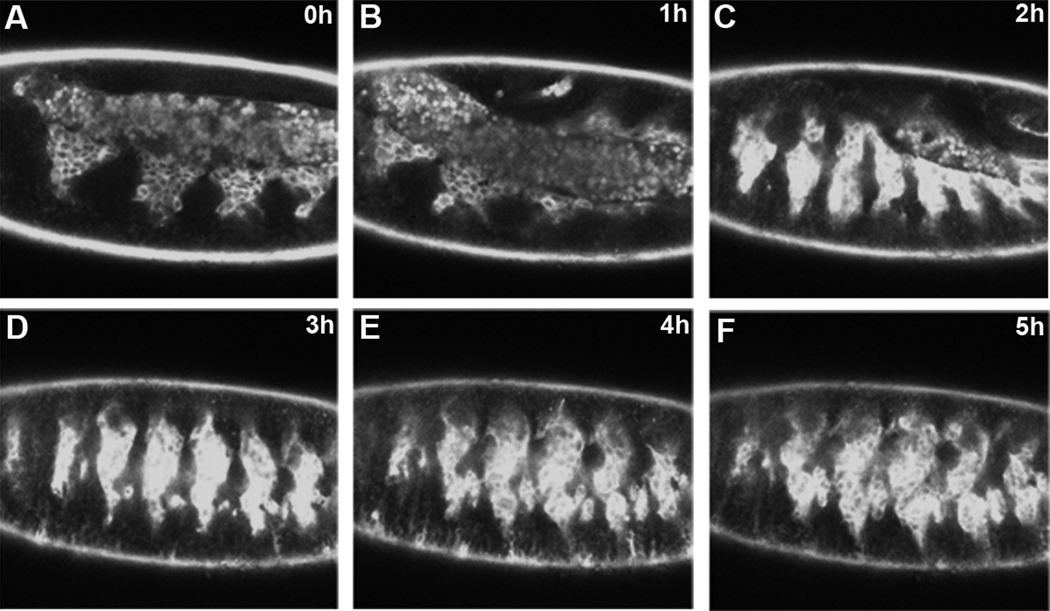
Figure 2. All of Drosophila myogenesis can be visualized using live imaging.
Lateral view of live twi-GAL4; Dmef2-GAL4 × UAS-GFP::actin embryo. These GAL4 lines strongly express throughout myogenesis. Each image represents a single frame from a time lapse sequence over the course of 5 hrs, covering stages 12–15. During this time, most of myoblast fusion is completed. Images are single optical slices. (arrow points to mesodermal hemisegment. * denotes autofluorescence of amnioserosa)

