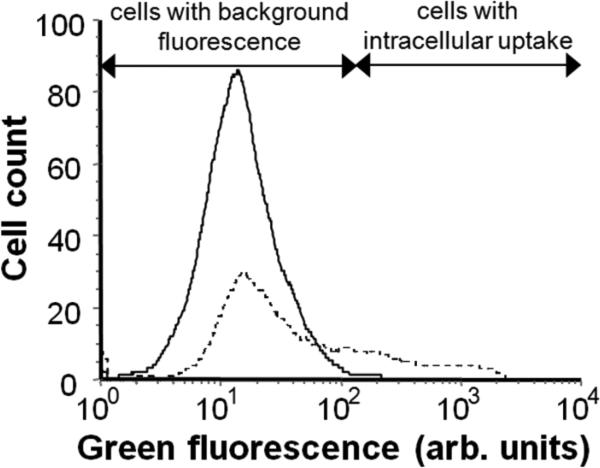
Figure 2.
Flow cytometry histogram of cellular green fluorescence displaying a control sample with background fluorescence (solid line) and a sample exposed to shear in the cell-shearing device (dotted line), which exhibits an increase in green fluorescence indicting intracellular uptake of calcein.

