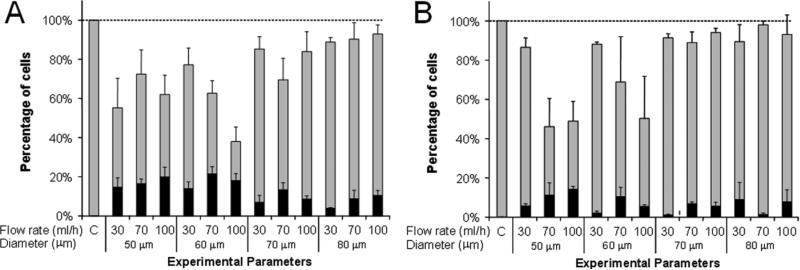
Figure 4.
Intracellular uptake and cell viability populations following shear exposure within cylindrical microchannels as a function of flow rate and of microchannel diameter and length. The total height of each bar represents the fraction of cells remaining viable, the size of the black stripe represents the fraction of cells with significant levels of intracellular uptake, and the size of the grey stripe represents the fraction of cells that were apparently unaffected. DU145 cells were subjected to shear by passage through microchannels of (A) 100 μm and (B) 250 μm channel length. Data represent the averages of n ≥ 3 replicates with SEM error bars shown.

