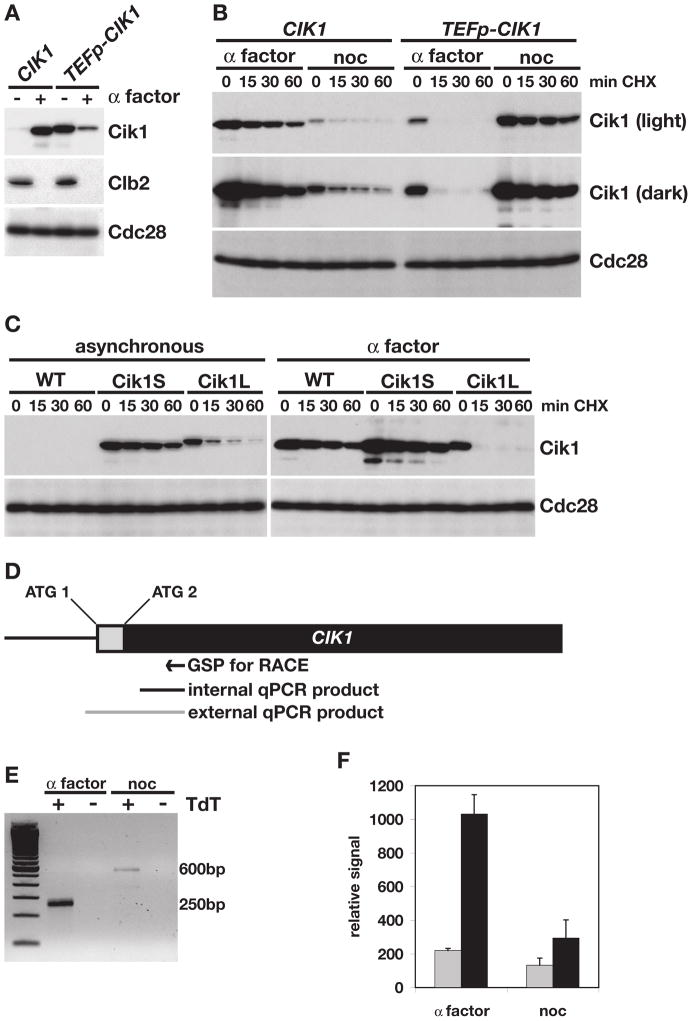
Figure 2. A smaller, stable form of Cik1 is expressed during mating.
(A) Western blot comparing Cik1-GFP and Clb2 levels in asynchronous (−) or α factor-treated (+) cells expressing Cik1 from its endogenous promoter (CIK1), or the TEF1 promoter (TEFp-CIK1). Cdc28 is shown as a loading control. (B) Cycloheximide-chase assay showing levels of Cik1-GFP in wild type (CIK1) or TEFp-CIK1 cells that were arrested with α factor or nocodazole and then treated with cycloheximide for the indicated time (min CHX). Light and dark exposures of the GFP blot are shown. Cell cycle profiles are shown in Figure S2B. (C) Cycloheximide-chase assay of Cik1 in wild type (WT), TEFp-CIK1 (Cik1L), or TEFp-ΔATG-CIK1 (Cik1S) cells. Cells were either asynchronous or α factor arrested before cycloheximide addition. Cell cycle profiles are shown in Figure S2C. (D) Diagram of the CIK1 open reading frame. The grey box indicates the sequence that encodes the N-terminal 34 amino acids not included in the Cik1S protein. The relative position of the first (ATG 1) and second (ATG 2) ATG codons are indicated. GSP indicates the gene specific primer used for 5′ RACE in (E). Black and grey bars represent the qPCR products generated in (F). (E) Ethidium-bromide stained gel comparing 5′RACE products from α factor and nocodazole (noc) arrested cells. As a control, reactions were carried out with (+) and without (−) the TdT enzyme in the last step of the RACE protocol. The two products are approximately 250 and 600 base pairs as indicated. (F) Comparison of internal and external RT-qPCR products (shown in (D)) from α factor- and nocodazole- (noc) arrested cells. qPCR reactions were done in triplicate in two separate experiments and all 6 values were averaged. Error bars represent standard deviations.

