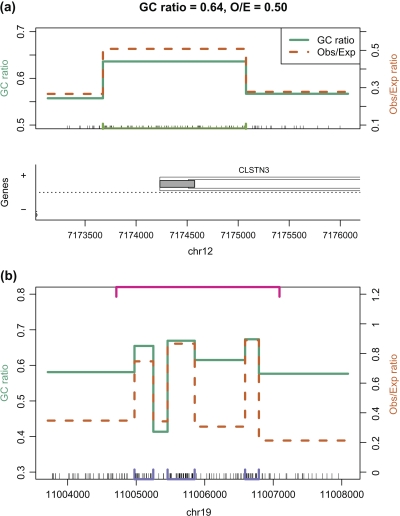
Fig. 3.
The observed to expected ratio (green) and percentage of G + C (orange) are shown for 2 regions of the human genome. CpG clusters are denoted with bars along the bottom or top of the plot. (a) For a region covering the 5′ end of CLSTN3 a CpG dense region that is not in current CGI list is denoted by the lime green bar at the bottom. (b) The top (pink) bar denotes one of Glass and others (2007) CGI that engulfs 3 Genome Browser CGIs (denoted with purple bars at the bottom). The regions between the Genome Browser CGI have low observed to expected ratio.

