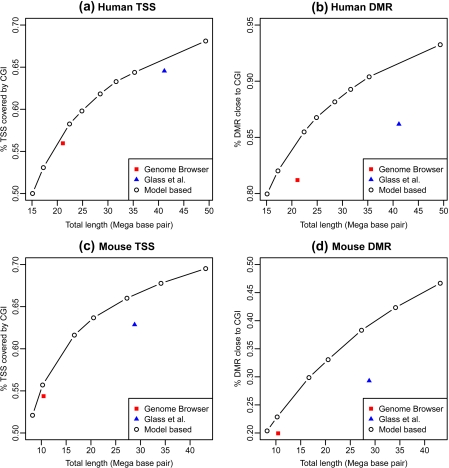
Fig. 7.
Receiver operating characteristic-like plots showing the sensitivity versus total length for different CGI lists (used as a measure of specificity). The sensitivity is defined as the percentage of functional elements associated to CGI. The 3 figures are for different functional elements: (a) Human (hg18) TSS, (b) human (hg18) DMRs, (c) mouse (MM8) TSS, and (d) mouse (MM8) DMR, respectively.

