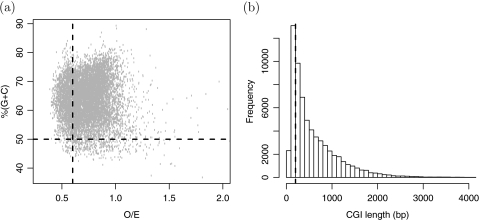
Fig. 8.
Statistical characteristics of model-based CGI list for human (hg18). (a) GC content versus O/E. The red vertical and horizontal lines represent the cutoffs used by the Gardiner-Garden and Frommer definition: O/E > 0.6, GC content > 0.5. (b) Histogram of CGI lengths. The vertical line is at the minimum length requirement of Gardiner-Garden and Frommer CGI definition (200 bp).

